Why Make a Media Bias and Credibility Chart?
With the increasing polarization of the media environment in recent years, many media bias charts have been created, each with a slightly different take on the best way to visualize the news media ecosystem. These tend to have limitations, such as reliance on human evaluators, complicated designs, or too much focus on political classifications. We believe that bias is just one dimension for rating how good a news article is, and ultimately what readers want is to find the most informative news sources. Our intention is to create a simple, easy-to-use resource that focuses solely on the informative quality of news articles. By focusing on key components of what makes an article credible and reliable, we have attempted to reimagine a media bias chart that prioritizes data, not politics.
What Is The Factual?
The Factual identifies the most informative and least opinionated articles from thousands of sources across the political spectrum. It does this by using a consistent and transparent rating algorithm to evaluate articles based on their sources, writing tone, author expertise, and publishing site, ultimately producing a grade between 0 and 100 for each article. The Factual uses this data to explore trends across the media ecosystem as well as to inform our daily newsletter.
Please check your email for instructions to ensure that the newsletter arrives in your inbox tomorrow.
How Does The Factual Rate Articles and News Sources?
At The Factual, our news-rating algorithm is built to measure how informative any news article is based on four straightforward, transparent metrics, each of which answers simple questions:
- Cited evidence and sources: Is each article supported by ample, diverse evidence?
- Writing tone: Is each article written to convey information or to agitate the reader?
- Topical expertise: Does the author have relevant expertise?
- Site quality: Do other articles from the same publishing site score well?
These four metrics can be seen in action below, and you can instantly score any article using our tool IsThisCredible.com or via our browser extension.
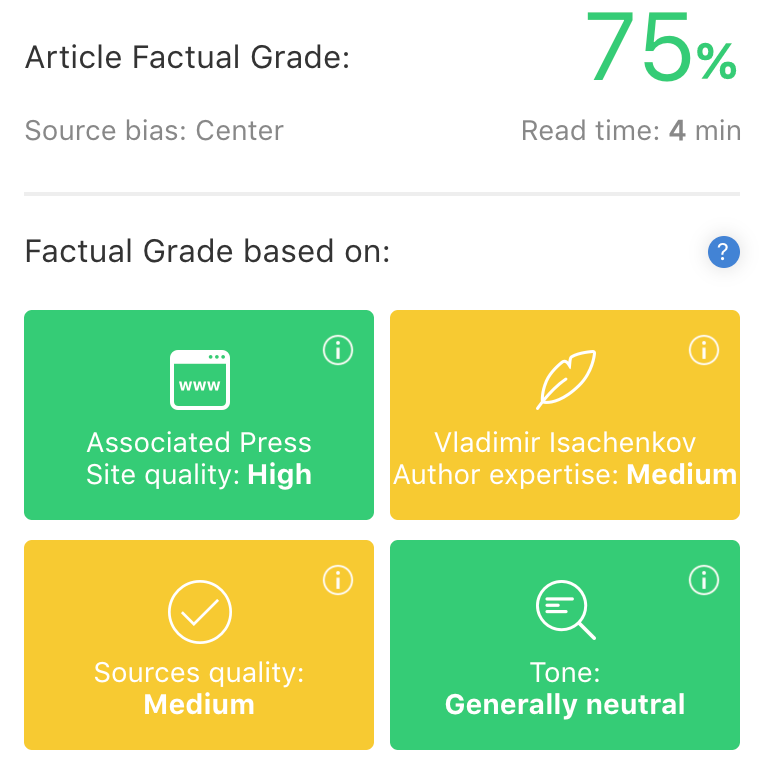
The combination of these four metrics gives us a percentage score from 0 to 100 for each article — what we call a Factual Grade. When aggregated over thousands of articles, these scores give us an approximation of how well every news site performs based on our metrics. Because this evaluation is automated, it can be applied to thousands of articles every day and is not subject to the individual biases of human evaluators, as is the case with other media bias charts.
This allows for comparison and analysis across hundreds of news sources, but this data is built article by article. Regardless of overall average scores, sources from across the political spectrum publish articles of varying quality. Our granular data at the article level enables the identification of highly informative, minimally biased news stories from anywhere in the U.S. media ecosystem, all accessible through our newsletter, app, and news site. To learn more about how our algorithm works, see our How It Works page.
Scores for all 245 sources can be seen in the searchable table below.
What Is a Good Score?
The Factual’s algorithm returns a percentage score from 0 to 100 each time it analyzes an article, but this score is not quite the same as a grade one might receive in school. For example, the average article score for all articles that The Factual analyzes is about 62%, showing that it is relatively difficult for an article to receive what Americans may traditionally think of as a high grade. The grade is also not meant to be definitive but rather an indication of our confidence that an article is informative and unbiased.
We generally advise that any article with a score 75% or higher is highly likely to be informative and relatively neutral; articles scoring between 50% and 75% may require greater scrutiny to confirm their content; and articles that score 50% or below may not be reliable and the reader should proceed with caution. Critically, The Factual is not meant to be a replacement for media literacy but rather is a tool to enable rapid identification of articles that are likely to be of higher quality.
Please check your email for instructions to ensure that the newsletter arrives in your inbox tomorrow.
How Did We Choose Which News Sites to Feature?
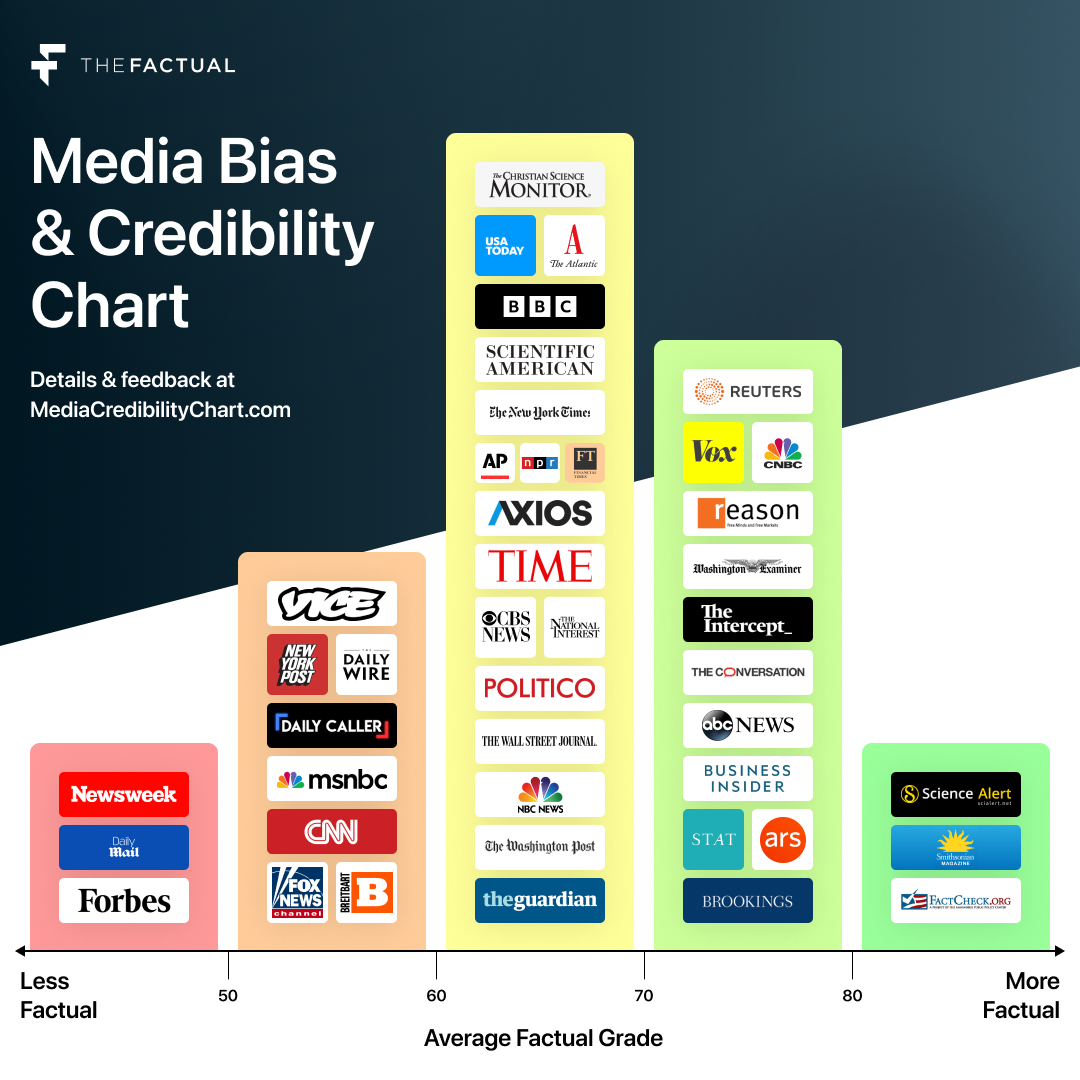
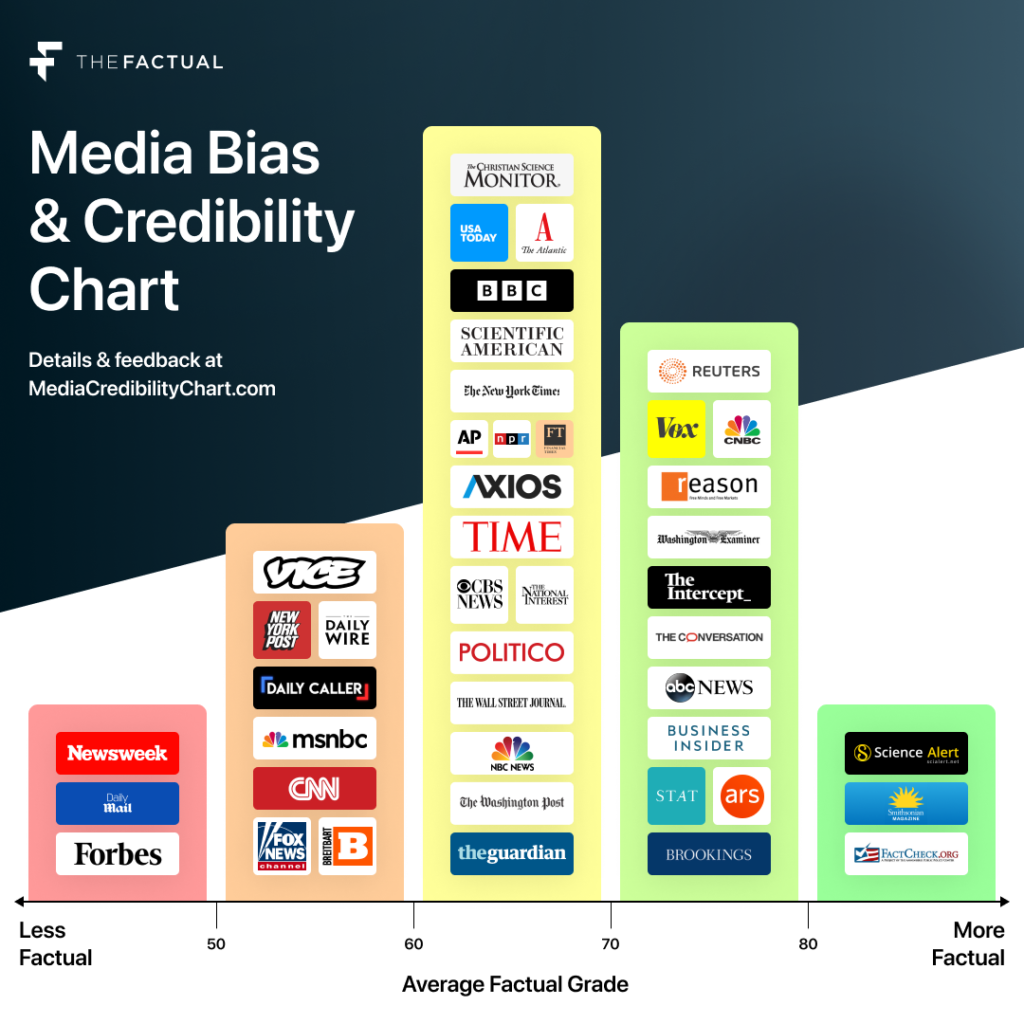
We built a dataset of 1,000 recent articles each for 245 major news sites. This told us a lot about the media ecosystem as a whole, such as how these sites perform on average. But this is far too much information to put into a simple, easy-to-use chart. Instead, we wanted to feature many of the most prominent news sources while also highlighting some lesser-known but highly informative sources.
Our selection reveals a rich, layered media ecosystem. There are numerous general news sources that deliver high-quality daily news (Reuters, Washington Examiner, Business Insider), but the best-researched, most unbiased news stories come from more niche sites that rely heavily on scientific and topical expertise, use ample sourcing, and tell stories in a minimally biased way (The Conversation, Science Alert, The Intercept). Our data also shows that some of the biggest names in news — such as Fox News and CNN — aren’t necessarily the best choices for staying informed.
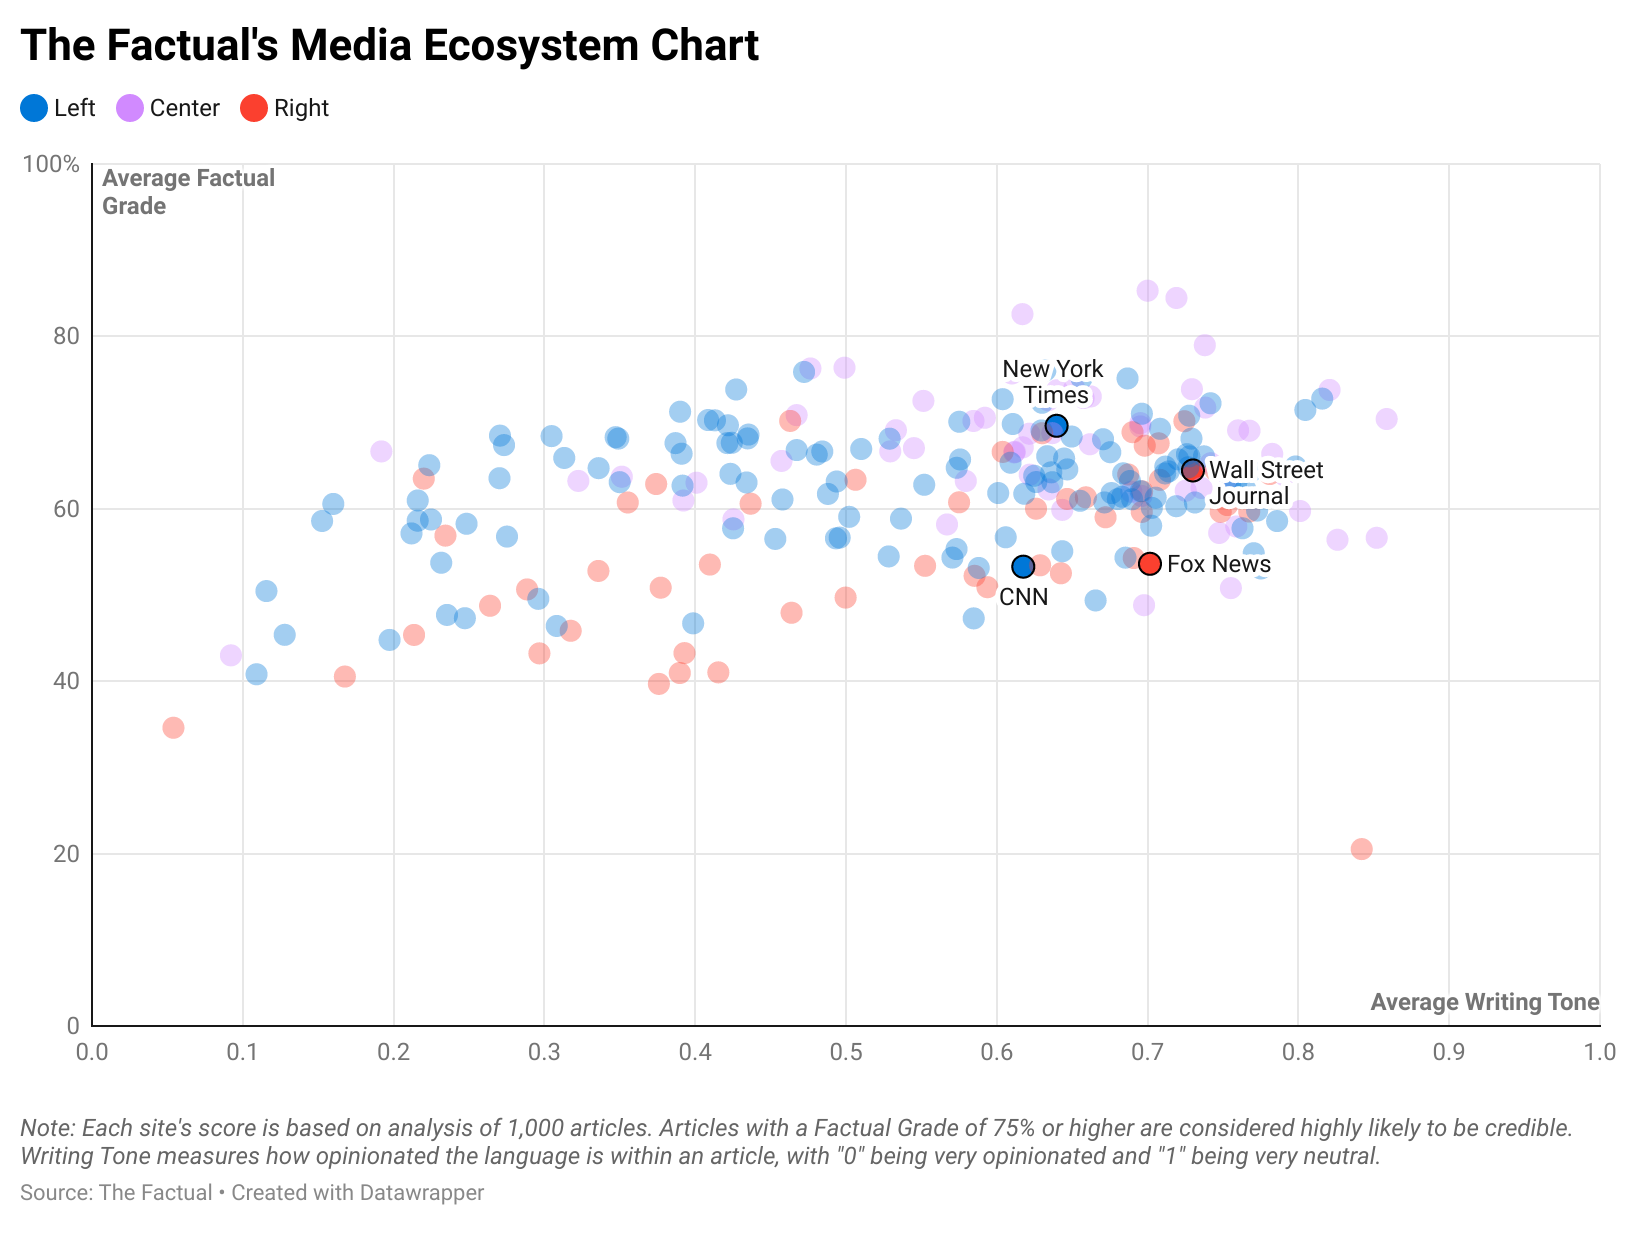
Below is a glimpse at the complete dataset that we used to inform our Media Bias and Credibility Chart. We spatially mapped out how all 245 news sources performed according to each site’s Average Factual Grade (Y-axis) and Average Writing Tone (X-axis). Sites that are closer to the top in the interactive chart are more likely to publish highly informative articles. Sites that are closer to the right side of the graph are more likely to use unbiased, neutral language in their reporting.
Questions and Feedback
Our goal with The Factual's Media Bias and Credibility Chart is to create a new way for readers to visualize the media ecosystem and find the best news. As with any such resource, there are difficult choices to be made about what to include, how to represent information, and how to make the product most useful to the users. If you have questions or feedback, please reach out to us by emailing team@thefactual.com.