The most famous political poll forecasting error in recent memory is Donald Trump’s victory over Hillary Clinton in the 2016 U.S. presidential election. Nearly every poll predicted Clinton would win — on election day the New York Times had an 85% probability of her winning. When Donald Trump won, countless articles were written on why the polls were wrong and what to fix in the future. But the diagnosis did not go deep enough.
The main culprit identified in 2016’s erroneous polls was underweighting the sample for education levels (i.e., there were more college-educated people in the sample than is normally found in the population and this group disproportionately voted for Clinton). But even after weighting for education in 2020, poll errors remained persistent and about the same size. Why is it so hard to get an accurate poll?
Why polling is missing the mark
The root cause is likely a declining survey response rate, which has fallen from 28% to 7% over the last two decades. This isn’t a surprise given that most of us are unlikely to answer a call from an unknown number and have a 15-minute conversation about our viewpoints on issues. Indeed, we might not even see the call given the prevalence of spam call blocking technology. Leading statisticians like Nate Cohn of the New York Times and David Shor point out that the people who answer phone surveys may not represent the average American very well.
This means the pollster has to re-balance, or weight, the sample based on groups they think are important to survey to get a representative sample. But how is a pollster supposed to know what variables to weight for? For example, why should a poll try to have a proportionate representation of racial groups? Do Black people consistently vote in a similar fashion and different from White people? Why not weight by socio-economic groups instead? Or maybe parental status or housing status are more important to consider when constructing a representative sample? Should these variables change dependent on the poll question?
Please check your email for instructions to ensure that the newsletter arrives in your inbox tomorrow.
A simpler approach to polling
Ideally, a poll surveys a cross-section of Americans without requiring weighting of groups so as to reduce any bias, or non-accounting for other groups, that can creep in with such rebalancing. And if the poll is quick it will likely get a higher response rate and perhaps is even be more likely to be accurate.
At The Factual, we’ve built a community of Americans across the country who see us as an unbiased source of news. Our readers span all 50 states and are a broad mix of political ideologies and socio-economic groups (based on the sample we recruited from Facebook advertising). Every day, our daily email newsletter contains a single-question poll on issues in the news and we get a 15-25% response rate.
What can we learn from The Factual’s polls?
The most interesting insight from The Factual’s polls are that our readers tend not to vote strictly along party lines.
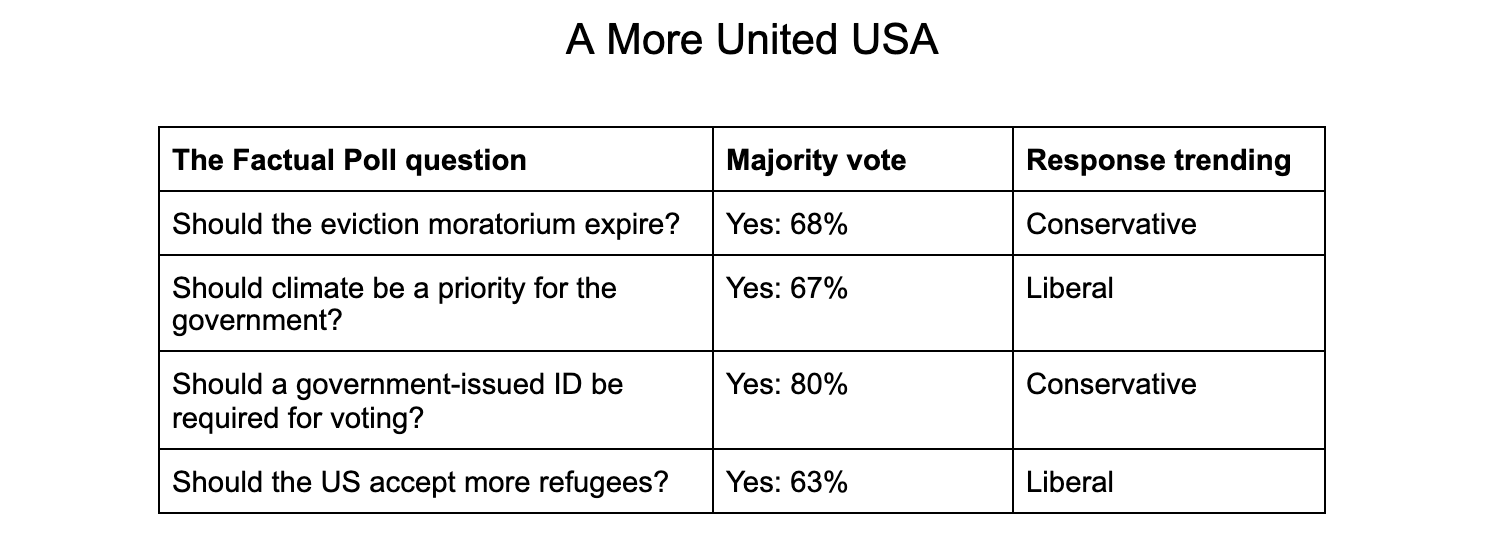
For example, a poll on if the eviction moratorium should expire saw 68% vote yes. Traditionally, one might think this suggests our readership leans conservative. Yet, a poll on if Donald Trump should run again in 2024 had 85% vote no.
There are scores of other such examples, such as 67% said climate should be a priority for the government or 63% said the US should accept more refugees, both traditionally liberal points of view. Yet a resounding majority of 80% said a government-issued ID should be required to vote – a typically conservative stance.
If The Factual’s readership were representative of Americans more broadly, it would suggest that the US is not as divided as one might think.
| The Factual poll question | Majority vote | Response trending |
| Should the eviction moratorium expire? | Yes: 68% | Conservative |
| Should climate be a priority for the government? | Yes: 67% | Liberal |
| Should a government-issued ID be required for voting? | Yes: 80% | Conservative |
| Should the US accept more refugees? | Yes: 63% | Liberal |
As a point of comparison, the aggregate response to The Factual’s polls often matches up to national polls. For example:
| Poll question | The Factual poll | Comparable poll |
| Should some level of student loans be forgiven? | 52% – No (The Factual; 712 responses) | 54% – No (Harris/Yahoo; 1,059 responses) |
| Should employers be allowed to mandate the covid vaccine for employees? | 50% – Yes (The Factual; 461 responses) | 53% – Yes (Politico/Harvard; 1,099 responses) |
| Should the government pressure tech companies to take down Covid-19 misinformation? | 46% – Yes (The Factual; 618 responses) | 48% – Yes (Pew Research; 11,178 responses) |
The Pros and Cons of The Factual’s polls
Unlike traditional polls, The Factual’s polls do not require guessing what groups to sample and weight. And while traditional polls take weeks to administer and costs thousands of dollars, The Factual’s polls are instant and results have a meaningful size within a day of being administered (polls usually get 500+ votes). This can help to quickly get a sense for how a policy decision or issue resonates with a broader audience.
That said, The Factual’s readership isn’t a random sample of the U.S. Rather, respondents are from a readership who have opted-in to our news service. On a demographic basis, there is no guarantee that The Factual’s readership reflects the U.S. population from a gender, age, race standpoint. But, as mentioned earlier, it’s unclear how and whether this affects every poll.
What we can say is that The Factual’s polls are indicative of sentiment among a group of civic-minded Americans. We will continue to develop our understanding of our audience and how it relates to the general population. And we’ll share our data widely and freely in the hopes that it can better inform discussion and perhaps even policy decisions on important issues.


