We recently launched a Chrome extension that helps people understand if the news they are reading is high quality and suggests better articles from across the political spectrum. The launch was a decent success after a string of failures.
We found success in part because of the helpful guidance that so many startups share on their blogs, particularly Lrn. We hope this post contributes back to the community so others may successfully launch their products as well.
Tl;dr (Too long; didn’t read)
- Video performs far better than blog posts on social media.
- LinkedIn drove far more traffic than Facebook despite similar reach.
- Product Hunt drives impressive and relevant traffic for consumer desktop applications.
- A simple website with a single CTA can deliver exceptional conversion rates.

Before the launch
As we read different launch stories we began to grasp the massive coordination effort required across our team, external advisors and early adopters. We created a Google doc with all marketing assets and linked it to a detailed launch plan so everyone could track progress and responsibilities during day.

To set the stage I should mention that our website had zero traffic before launch. Our social channels had about 100 followers (Twitter, Facebook) and our blog had <20 followers.
Launching with a laugh — video post
We drove traffic to a funny launch video instead of a blog post. This turned out to be the best decision we made as the video was light-hearted and memorable.
Twenty-four hours after launch we had more than 2,000 views of the video and by the end of the week we had racked up 10,000 views.
One reason the video turned out well was the phenomenal direction and editing by my friend, and professional videographer, Ken White. His effort was non-trivial.
I had no idea that it takes about 8 hrs of shooting to get 1 minute of footage. And beyond this Ken spent much time refining the script, turning it into shot sequences, deciding on scene selection, and editing all the footage with the right music overlay to make it slick. The result was a hundred times better than our original iPhone version.
In summary: if you do a video with live action get a pro to help.
Insights:
- We were surprised to learn we could not inject a CTA to our website at the end of the video. On YouTube you need to be a channel partner (minimum 10k subscribers) in order to do this. Without this CTA the click rate to our website likely dropped. By subtracting traffic sources and conversion rates we knew of (see below) we estimate the video had 8%-21% click-through to our website.
- A second question was why our views on LinkedIn were much higher than on Facebook — 8,000 versus 2,000 after 7 days — despite a similar collective reach on each platform and similar calculation for the views metric. One possibility is that our funny video was more unusual on LinkedIn than on Facebook, which is full of “lighter” fare content. Another possible reason is that our network on LinkedIn has more meaningful relationships with people who will take active steps to support us.
- Our launch blog post fared poorly insofar as followers/shares and had just 147 views (47% read ratio). We clearly focused our CTA on the video so this was somewhat expected. The post may have longer-term SEO benefits but it seems like video > blog post these days.
What we’d do differently next time:
- Upload video directly to each social platform so it can be auto-played. Views jumped after we swapped out the external YouTube link that we initially shared.
- Caption your video so people can watch with sound off. This takes just a few minutes to edit the auto-captions Facebook provides.
- Post the video from your Facebook and LinkedIn company page and share the same post repeatedly to various groups. This accrues all views to one post (which makes it more likely to appear in other people’s feeds organically). Moreover you keep the asset and its stats on your company page.
Product Hunt
We had read that most Product Hunt (PH) users are desktop and given we were launching a consumer extension this seemed like a good fit. Getting on PH’s homepage is what drives the most traffic so that was our stretch goal.
Much to our surprise we did make it to the home page, with 151 votes in 24 hours (214 after 7 days), and were featured about halfway down just behind Google’s Tensor Flow app. (Being this close to anything Google releases is a dream on its own). The resulting traffic to our homepage was dramatic, accounting for 40% of all traffic on launch day.
The biggest reason we succeeded was we planned for our six external advisors to post early reviews and share our PH listing page with their social networks. One advisor, Alan, also wrote a user review which helped to back up the claims made by our product. This early momentum was the reason our PH listing took off.
One interesting point to note: We were ahead of some other apps on the home page who had more votes than we did. We think that’s because the category your app is in matters in home page selection and our category — News — doesn’t get that many submissions.
One thing we’d do differently in future is post even earlier than 5am PST so as to get more of the European traffic. Yes it might have meant 24 hours without sleep on launch day but that’s ok.
Email marketing
Our email list was primarily 4000 LinkedIn contacts with about 400 other contacts consisting of advisors, early adopters and potential partners.
The biggest surprise from the email outreach was how many old friends we reconnected with, many of whom believed strongly in our mission. Indeed, our most detailed product feedback came from these people and several went on to share our launch video which was key to our overall traffic stats.
The above commentary is key to putting in perspective the rather average email stats below.
- Delivered: 4,544 across 7 email sends
- Opened: 1794 → 39.4% open rate average (high of 45%)
- Clicks: 293 → 6.4% click rate average (high of 8.4%).
Incidentally, we split test the headline for the email with two small sends (about 100 delivered emails each) and found one performed 2x better than the other on open rate so used that on subsequent sends.
CTA analysis
Our emails had a mix of CTAs:

Stats:
- 44% clicked on video
- 31% on homepage URL
- 15% Product Hunt (8% for Hacker News when we swapped that in on one test email)
- 12% install extension CTA (link)
- 0% on install extension CTA (button) — surprising!
If we could do it over we would have split test the CTAs but didn’t realize until after the first subject line test that it’ll take an hour to get statistically significant results. (We used this statistical significance calculator.) Given that many of our contacts were east-coast we couldn’t afford any further delay so launched with the email above.
Launch Results

We started the day with ~111 installs and after 24 hours were at 412 installs, a net gain of 301 installs. We had just 18 uninstalls in the same time period.
We continued to have good trailing traffic the next few days and ended the week with 750 installs, a net gain of 639.
This was far above our initial projection of 100–200 installs, which we based on an expected 10% conversion rate for our website off 1,000 visits.
So how did we do so much better? The answer — a simple and clear website.
CivikOwl Website — Robin to the Video’s Batman
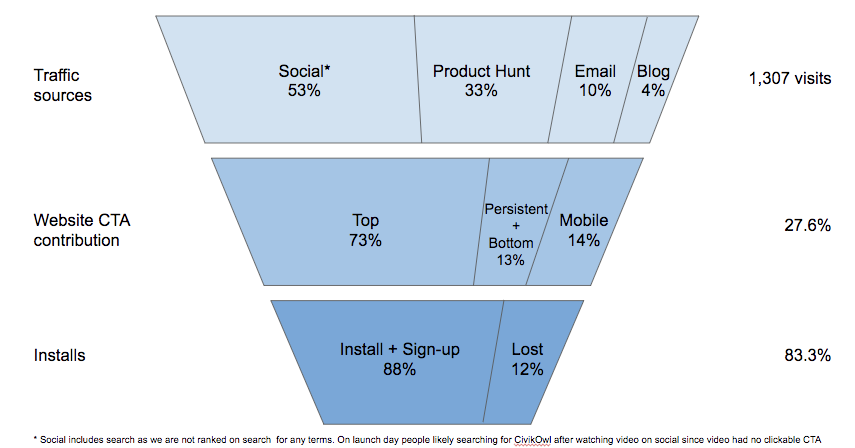
Traffic sources
Overall, visits were 30% higher than we expected, in large part due to the video. Most of our traffic was classified as “Direct” by Google Analytics.
- This included Product Hunt, which was about 50% of the Direct traffic (rather than being grouped into “Referral”).
- Since the video did not have a CTA we assume that most of the remaining direct and search traffic were from the video, i.e. driven by social.
75% of our traffic was desktop (86% Chrome browser; 60% US based). This meant most of it would find the Chrome extension relevant, which helped drive conversion.

CTA analysis
Our conversion rate on the website was 3x better than we projected. This appears to be because our website was easy to understand.
We took inspiration from Grammarly, who have a long history of promoting a very popular Chrome extension on their website. We had a similar 3 CTA strategy on the home page— one at the top before the fold, one at the bottom, and a third that was persistent in the toolbar.
The performance of each 24 hours after launch:
- Top: 262 clicks
- Bottom: 15 clicks
- Persistent: 32 clicks
- Total: 309 clicks
People viewing our website from a mobile device saw mobile-friendly CTAs:
- Email me extension link: 37 clicks
- Mobile sign-up: 15 clicks
309+37 = 346 attempted installs. This is close to the 301 recorded install gain which means 45 did not accept the subsequent click to add the extension.
Install rate: 301/1307 website visits = 23%
Overall conversion rate: (346 installs attempted + 15 mobile signups) / 1307 website visits = 27.6%!
This 28% conversion rate was almost 3x what we expected. This conversion rate did not materially drop in subsequent weeks, as we got more random traffic — i.e. people who we were not connected to us on social. So this likely means our website was clear and easy to understand.
After the launch
After our launch we interviewed a half-dozen users to get detailed feedback and check comprehension and satisfaction. This helped us uncover some gaps in understanding which we missed before launch because we did not use brand new test subjects each time in previous tests.
We shipped an update a week later and while usage remains modest (20% WAUs) our uninstalls are minimal so it seems people like the value proposition even if they aren’t seeing it very often.
This makes sense as most people get their news on their phone. Indeed, we intentionally shipped an extension first because it was an easier way to test product-market-fit. That’s why it’s a Minimum Viable Product.
This brings us to the present. We’re building a mobile app to help you do two things:
- See just the important news of the day, presented with viewpoints across the political spectrum.
- See news and articles related to your interests that you’re unlikely to find elsewhere.
If you’d like to get a sneak preview please email me: arjunm@civikowl.com or sign-up on our mobile website.
There are many more lessons from the launch including our lack of success with the press, mistakes made in earlier website iterations etc. Happy to elaborate in the comments section if you have questions. Please ask below!